Graphical Elements

.
.

Symbols, icons and graphics

  • Use icons to portray a simple message to aid memorability and help improve communication. 
  • Use simple vector graphics with a minimum amount of details to convey the message.
  • Use a single corporate color on white background, or reverse out of a colored background.
  • BASF icons are solid filled shapes.  
  • Icons are used in positive or negative form.


Downloadcenter

.

Infographics

An infographic is the combination of an icon with explanatory text. The icon attracts attention and the text provides the respective message.

Use only one BASF corporate color or tints of it.

Preferred shapes for info graphics or their elements are circles, squares and rectangles.

Infografik_en.png
.

Depicting people

.

Illustrations and Explanatory videos 

Every illustration should be consistent with the other elements in the communication. 

  • Maintain the natural proportions when depicting people. Base the proportions you use on the original photographs. 
  • Despite all abstractions, our illustrations should depict authentic people in realistic settings and real-life situations. 
  • No outlines, but shapes solidly filled with corporate colors or their gradations. 
  • Don’t emphasize outlines. Avoid decorative elements. Use a simple, reduced design.
  • The visual style defined for illustrations also applies to explanatory videos.
IDo1_Zeichenfläche 1.png
.

Diagrams

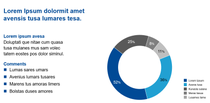
Use two harmonious corporate colors only per graphic unless the complexity of the message requires a third color, use gray. 

Use tints of the same color to differentiate information strands.

Praesentation_9.png
.

Charts

  • Use horizontal lines only. Thicker lines indicate the upper and lower ends and divide sections of the chart. Thin lines are used to divide rows.
  • Vertical columns are divided by leaving white space between them.
  • Table titles are formatted in the size of the body copy, but in bold.
  • Use a light tint of the corporate color used on the page to highlight the most recent and important figures.
Diagramm.png
.

Maps

Maps are drawn using single solid colors, derived from the corporate colors or neutral gray.

  • Draw maps based on one corporate color. Use as many lighter tones of this color as you need for your message.
  • Every area is filled with only one color, without gradients, structures, shades or other effects.
  •  Make borders visible through white lines.
  •  Highlight countries or regions by using one solid color.
  •  The templates available on Brandweb are our offer for an easier production. Please consult the communications function of the respective regional division on any content related issues, e.g. showing politically controversial borders.
  • Use the templates. You can use the global map and maps of all regions in all corporate colors as well as with or without identification of BASF sites as the basis for your maps. The templates are available as vector graphics for the creation of printing templates for four color printing (ai) and for presentation graphics (PPT). You can alter these templates to suit your project’s requirements, add to them, or remove irrelevant details, as long as you follow the design principles defined in this section.
  • Conformal and area depiction are both possible. We offer both versions in the templates for global maps; the depiction of regions is only available for download in conformal Mercator projection.
.

QR codes (Quick Reponse codes)

  • QR codes are machine-readable labels that allow users to access online information instantly
  • Keep it simple: QR codes are for practical use (functional) by definition, and in most cases are not the main element of the media/content, meaning that they have no need to convey any other message than the stored information

Consider which medium is used:

  • Print media:
    • The distance to the media matters: People should be able to scan it from a long distance
    • A minimum size of the QR code must be respected: 20x20mm
    • Take the environment into account: There should be an internet connection if the QR code links to online content
  • Digital media: To ensure a responsive design, please respect a minimum size of 240px

Testing is crucial: Make sure it is readable by several QR code scanners.

Web

In general, the QR code and the BASF logo should be kept as two separate and independent elements. Therefore, the following rules apply:

  • Respect the minimum distance (represented by one "X" in the graphic) between the QR code and the BASF logo
  • The BASF logo guidelines apply: The logo is placed on a plain background and the minimum size of the logo has to be respected (15mm)
Logo-Abstand

Don'ts

The same general principles of the BASF Visual Style should be applied for all graphical elements:

  • Two-dimensional style
  • Right-angle shapes
  • No use of outlines
  • Deliberate use of corporate colors:
    • Please use either a complete black-and-white style or one single full-tone corporate color combined with black or white
    • However, the use of black as a background color for colored QR codes is not permitted
    • Because of the low contrast, the combination of the BASF light blue color on a white background is not suitable

Dos

Don'ts

  • Use only one QR code per medium 
  • Be as informative as possible:
    • Add a disclaimer/call-to-action so the user knows where it is leading to (e.g., "Scan here", "Just scan and go!")
  • Do not use a transparent background when placing the QR code on a photo/picture:
    • In this case, create a plain white, or colored background for it
  • Protect the QR code area: Make it an independent element
    • When used next to any other elements, make sure to respect a minimum protection zone around the QR code

Important:

If you use a colored QR code (other than black-and-white), try to stick to the same main corporate color used in the media (according to the color of the logo bar or the logo pin color).

Dos

Don'ts

.

Key Visuals

In a key visual  the constant element is not the image, but its subject. The images vary and the target audience will hardly see the exactly identical image again, but the subject is defined in a way to ensure that the relation to the topic, the initiative, the project or brand can be easily recognized.

In the webinar, you find many great examples and you will learn about the theory behind key visuals, logos and icons.


Contact and feedback

The team Brand Consultancy is happy to support you in case of questions: contact.
Please let us know what you think about our Brand Portal: Feedback.